
1

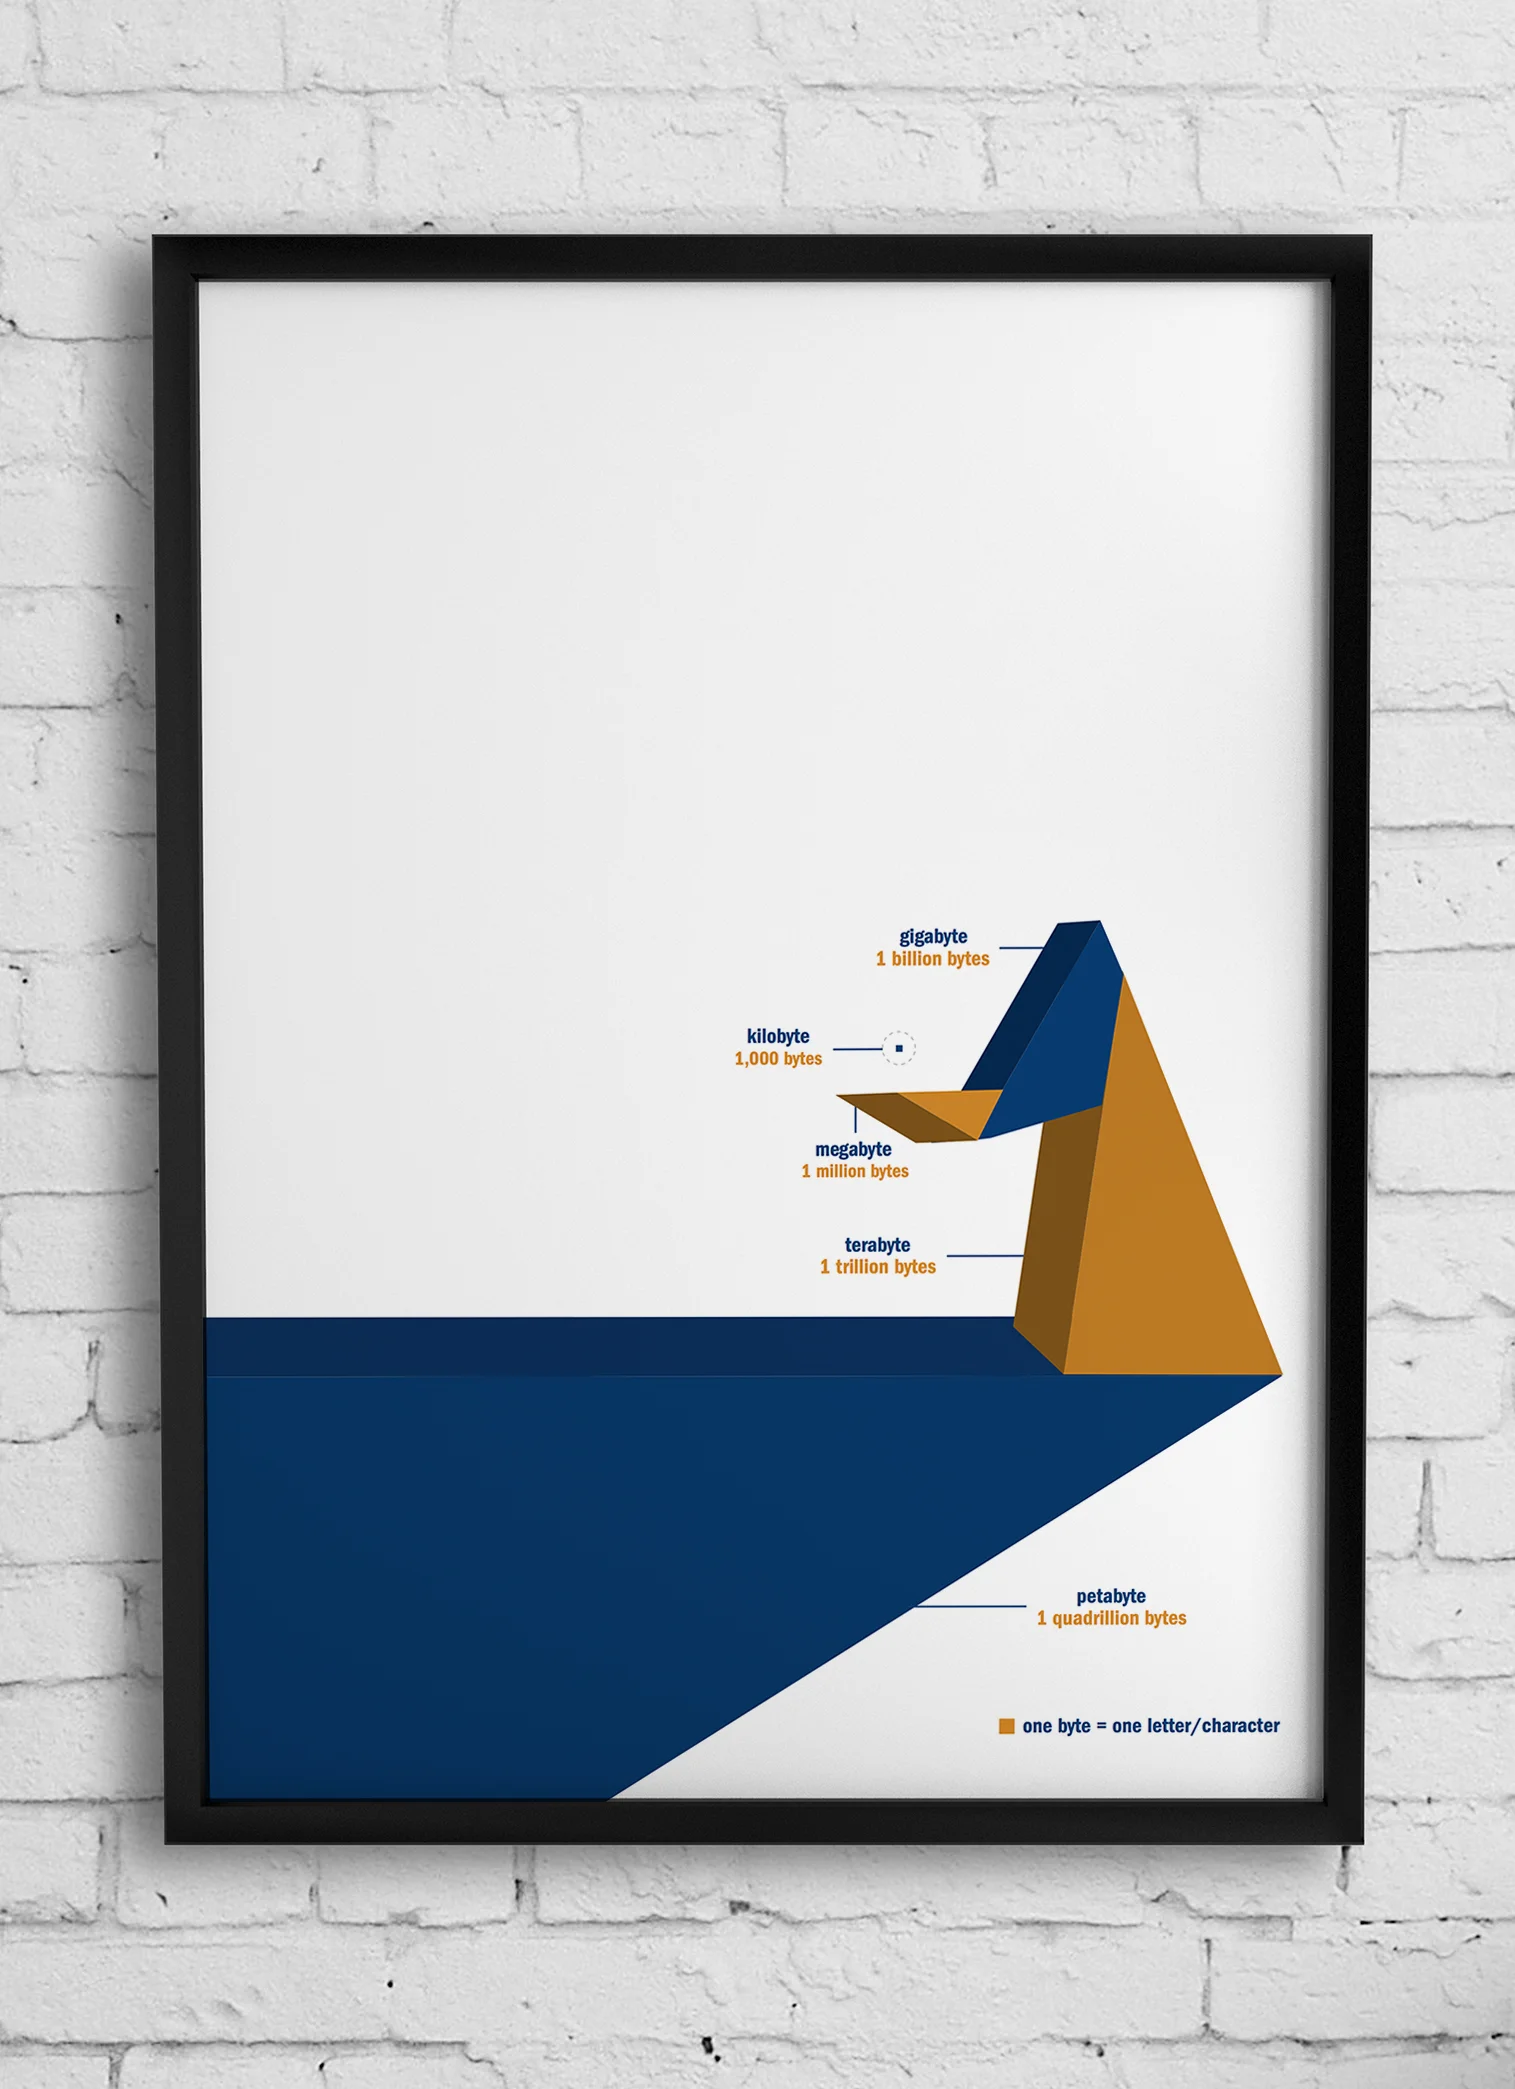
This infographic was created in Adobe Illustrator for the Colby Magazine. It was meant to accompany an article about Colby’s new computational biology major. Its purpose was to visualize the growth of data. The design changed drastically from the original, and in the final draft became 3D.